


Spending on Mobile ads has grown from $10B in 2015 to $276B in 2020 worldwide. It is expected to hit $495B by 2024. That’s a 4850% increase.
While spending has increased exponentially, efficiency has decreased. As more businesses have recognized mobile as a key sales and engagement channel, the increased noise has made it harder to acquire quality installs.
So, how is a marketer supposed to keep up? With competitive Ad Intelligence.
Ad Intelligence
To stay ahead of the game, it’s more important than ever for marketing teams to be able to test and pivot mobile ad strategies faster than the rate of Marvel movie debuts. Apptopia’s Ad Intelligence means your competitors do the work for you. Leveraging Competitive Intelligence (CI), you can learn from and apply insights from your competitors’ mobile advertising performance data.
Let me explain. We all know that marketing to consumers is complicated. There is an almost infinite number of ways to segment these diverse audiences. After all that work to identify the ideal customer, mobile growth teams are tasked with more codes to break. What apps are my target customers using? What Ad Creative would get them to pay attention? How can I justify the budget request to my boss?
Ad Intelligence helps teams answer these questions and more.
Apptopia’s Advertising-specific data points include (but are not limited to):
- Observed Impressions
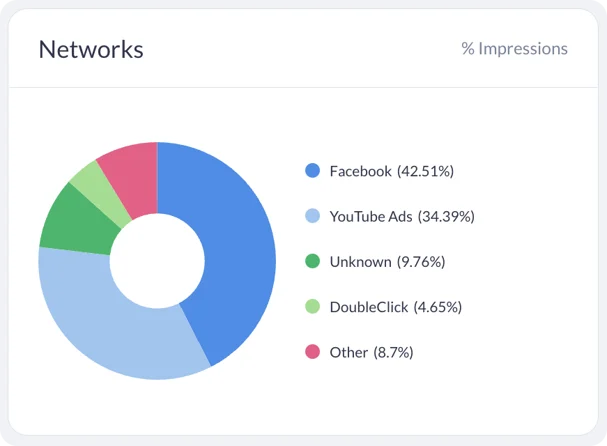
- Ad Network
- Mediation Networks
- Ad Publisher
- Ad start and end date
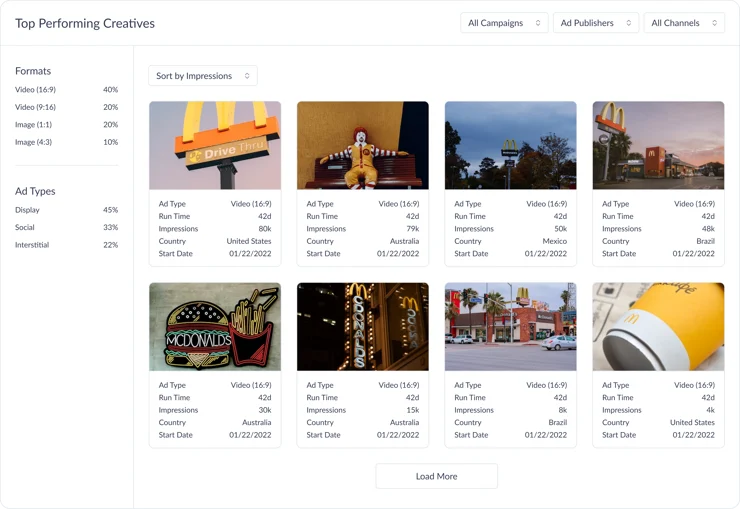
- Ad Creative
- Creative Type
There are hundreds of Ad Networks that you could work with. Knowing where to start is no easy task. Why not start with a hint from your competitors?
With access to Advertising Intelligence, growth teams, and marketers can take their first step forward simply by seeing the Ad Networks its app’s competitors are leveraging for ads. In a few clicks, teams will know “apps like me advertise here.”
Correlating Competitive Intelligence to Performance
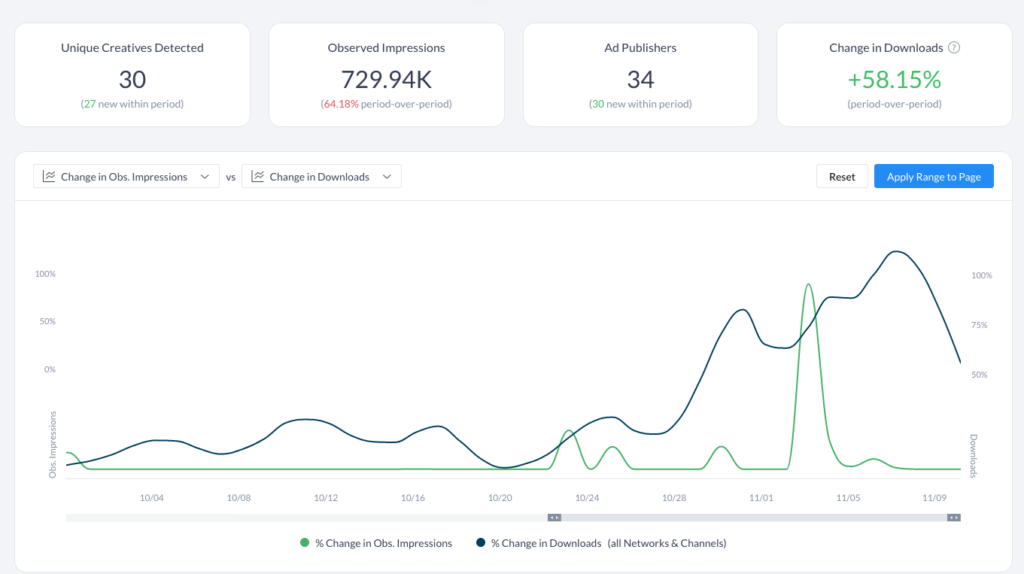
The magic of Apptopia’s complete mobile competitive suite of products is that you can overlay app performance metrics on top of campaign performance to see the impact it had on both user acquisition and retention.
For example, an increase in Observed Impressions – or number of ad views – at the same time as an increase in Downloads indicates a change in Creative strategy. Then, you can dig deeper to understand if the change was driven by the Creative itself (new design/ messaging), Creative Type (format, e.g., video, display, interstitial), or Creative Volume (the number of ads running at once).
The chart below shows an instance where the Creative Volume stays relatively constant, but new ad Creatives were swapped into the rotation, potentially causing more Observed Impressions/ Downloads. In other words, this is indicating a signal worth analyzing further in the Creative Gallery, which features top ads across prominent mobile networks.
Demystifying the Magic of Marketing
In the time it took you to read this article, teams can surface a competitor’s Advertising Strategy and be on their way to defining a baseline (e.g., “Apps in my app category that are in the top 20 advertise here, with creatives that say X, primarily through Display”). From here, marketing teams can develop a data-driven thesis for their new strategy or next campaign. Moreover, Ad Intelligence data is updated daily, allowing teams to measure performance relative to the market and spot opportunities to optimize continually.
Stop guessing and start getting results. Ad Intelligence unlocks efficient growth to drive your success. 


